

Is This a Stock Market Buying Opportunity or the Worst Time to Buy Stocks in 25 Years?
Hey, Ross here:
If you are hunting for a stock market buying opportunity right now, the numbers argue against it. The Federal Reserve just raised interest rates for the first time since 2023. The 10-year Treasury yield climbed back to 5%. The S&P 500 is sitting near 7,600 and change at 26 times earnings.
Put those three numbers together and you get a setup this market hasn't seen since the year 2000: the US government will now pay you more to lend it money than the stock market pays you to own it.
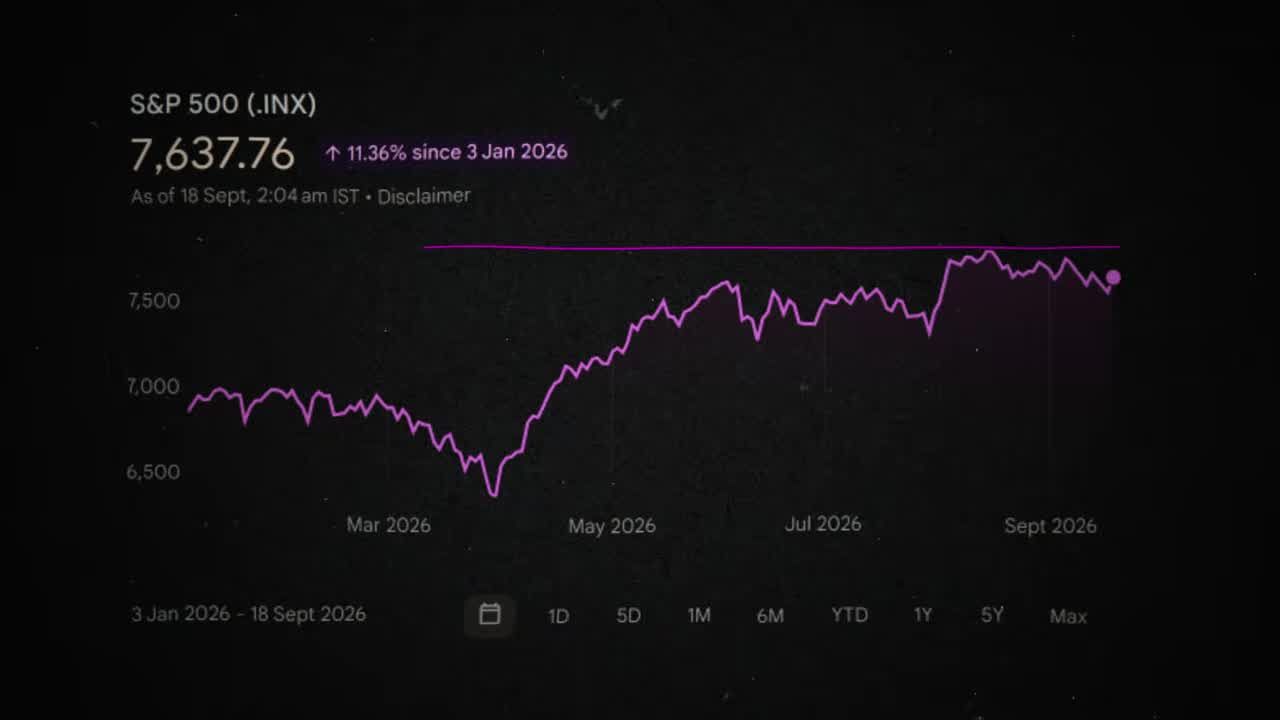
That doesn't mean you should abandon stocks. It means the stock market buying opportunity everyone assumes exists right now, the "just keep dumping money into an index fund" strategy, is broken math if you're putting new money in and holding for ten years.
There's a very different story playing out underneath the index, and that's where the real money is going to be made over the next decade.
If you're still loading every paycheck into an S&P 500 index fund, or you're a few years from retirement wondering whether to take some chips off the table, the data below is built for you.
Is Now a Good Time to Buy Stocks?
Bottom Line: The math behind buying and holding an S&P 500 index fund no longer works when bonds pay more than stocks earn. The real stock market buying opportunity now sits in select individual stocks and undervalued commodities, not in the broad index.
Not for long-term buy-and-hold money at these prices.
The S&P 500 trades at roughly 26 times last year's earnings, which flips into an earnings yield of about 3.9%. Compare that to the 10-year Treasury near 5% or a three-month T-bill near 4%, and stocks are the worse deal.
Every stock carries what's called an earnings yield. It's just a P/E ratio flipped upside down. If a stock trades at 20 times earnings, that's 20 over 1. Flip it and you get 1 over 20, or a 5% earnings yield. That's the profit the company generates for every dollar you paid for it.
Think of it as the rent your stock pays you.
Right now, that rent check is 3.9%. Meanwhile:
- A three-month T-bill pays close to 4%, the closest thing to risk-free on the planet.
- The 10-year Treasury pays just under 5%.
- The S&P 500 earnings yield sits at roughly 3.9%.
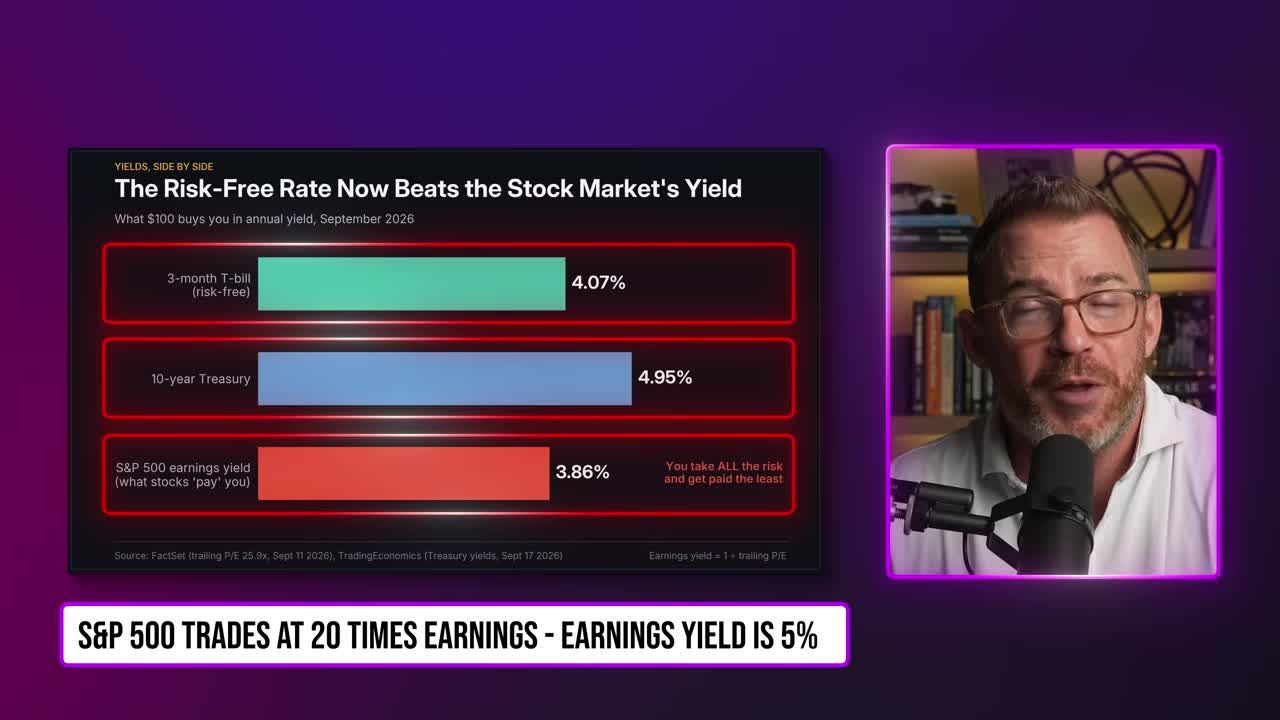
You can lend money to the US government, take essentially zero risk, and collect 4 to 5%. Or you can buy the stock market, take on crashes, recessions, and 50% drawdowns, and collect 3.9%.
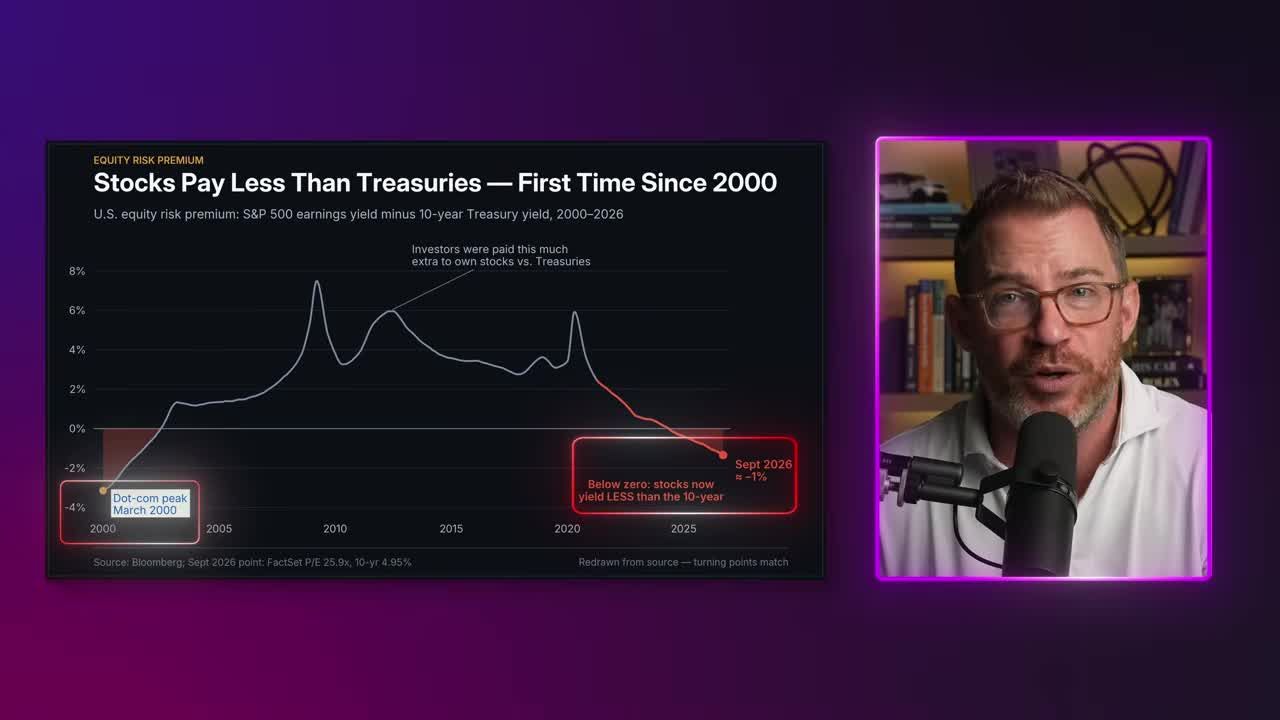
Wall Street has a name for the gap between those two numbers: the equity risk premium. It's the extra return you're supposed to get paid for taking stock market risk. Historically that premium runs 3 to 5%.
Right now it's negative. The only other time it went negative was the top of the dot-com bubble.
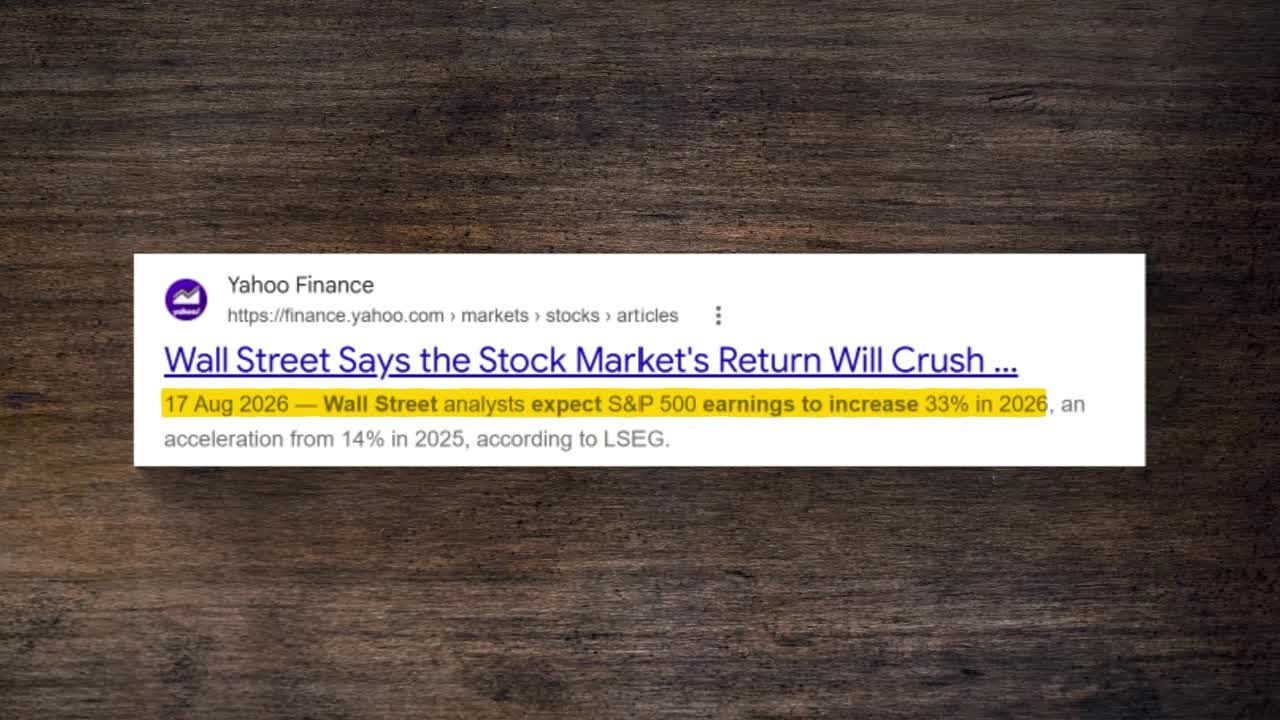
Wall Street's counterargument is that you should use forward earnings instead of trailing earnings, since profits are expected to grow 30% next year. Fine. Give them that.
Even in the best case, where every rosy forecast comes true and the market keeps funneling a quarter trillion dollars a year into the biggest tech names, the premium only goes from negative to about zero. That's still the worst deal in 25 years. And that's the best case.
When Was the Last Time This Signal Flashed?
The last time the equity risk premium went negative was March 2000. If you bought the S&P 500 index then, you didn't get back to even until March 2013. Thirteen years underwater, with a 50% drawdown followed by a 57% drawdown along the way.
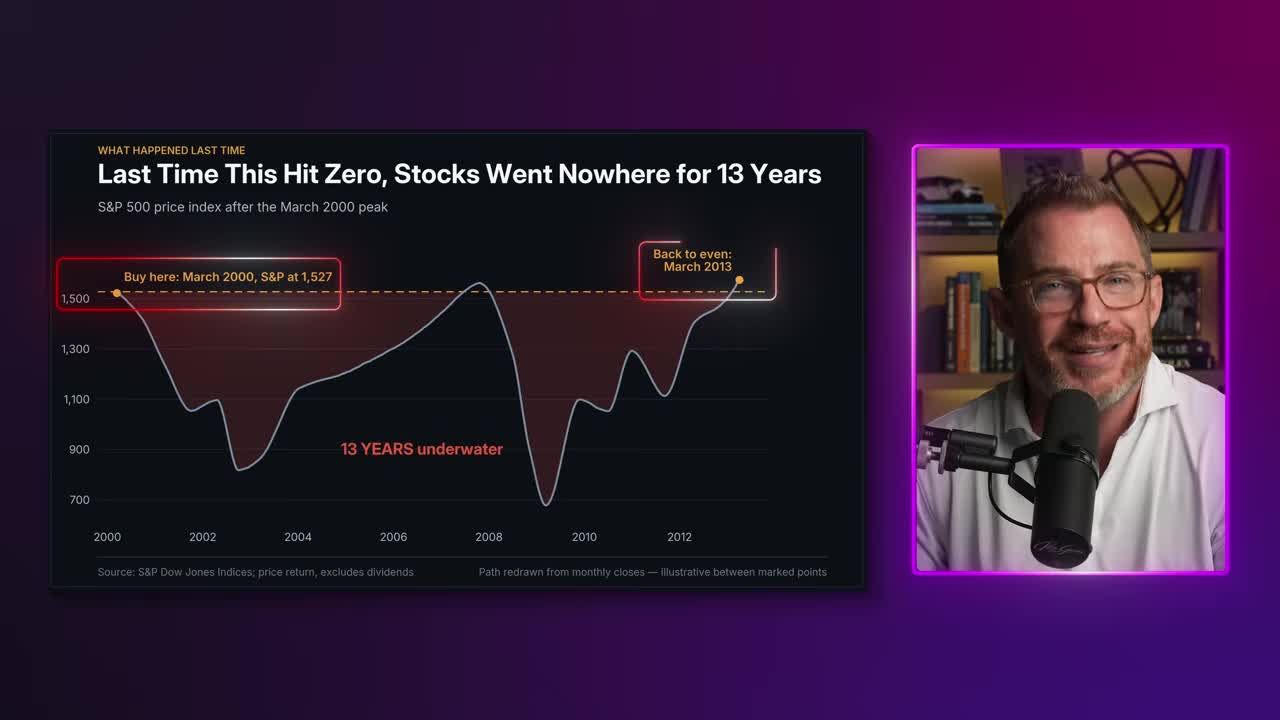
You collected a few dividends in that stretch, sure. But nobody puts money into the stock market to earn one or two percent a year. That was a lost decade, and then some.
A lot of investors today have forgotten that lost decade ever happened. The last seventeen years have been so good that plenty of people now assume a guaranteed 12% a year is just how stocks work.
Nothing could be further from the truth. The price you pay determines the return you get, and right now that price is the highest it's been this century.
Which is exactly why I do a lot less investing and a lot more trading in this environment.
To be clear: I'm not saying stocks crash next week. Expensive markets can keep getting more expensive. In 1999 the S&P was already stretched and still ran another 20% before it finally broke.
But the buy-and-hold math for new money is broken. Buy the index here, hold it for ten years, and the odds say you get a below-average return for taking full stock market risk. That's a lousy bet.
Trade or Invest in This Market?
In a market where the index goes nowhere for years, individual stocks and sectors still make enormous moves. That's why trading shorter-term opportunities beats parking new money in index funds and hoping.
Consider what happened between 2000 and 2013 while the index sat flat:
- Homebuilders tripled.
- Gold climbed five-fold.
- Oil surged from $20 to $140.
- Hundreds of individual stocks doubled and tripled, some in months rather than years.
That's a lot of what I focus on now: swing trades. Not day trading, but shorter-term positions held for a few weeks or a few months, targeting 30%, 50%, sometimes 100%-plus gains.
I date stocks. I don't marry them. Same market, same stocks, completely different game.
And the part most people miss: a trader doesn't need the market to go up. A trader needs the market to move. When you have the Fed hiking, the 10-year at 5%, valuations stretched to their limit, and euphoria creeping in, that's exactly the kind of market where things move.
This isn't speculation. It's pattern recognition.
Get an entire year of live weekly mentoring sessions, my newsletter, indicators, bonus reports, tons more. Click the link and I'll see you in the next live session.
Join my Black Ops Trading ClubWhat Should Long-Term Investors Do With Their Cash Right Now?
If you're not a trader and never will be, that's fine. Not everyone should be. But the old "cash is trash, selling is for suckers, just hold" advice needs an update given where risk-free yields sit today.
For fifteen-plus years, cash paid you nothing, so holding stocks through every dip made sense by default. That's over.
A three-month T-bill, backed by the full faith and credit of the United States government, currently pays about 4%. You can buy one through any brokerage in about 30 seconds using the ticker SGOV, priced around $100 a share. It holds a basket of zero-to-three-month treasuries and kicks out a cash dividend every month.

If you're late in your working years, sitting on a big 401(k) gain, taking some profits and moving 20 to 30% of your stock money into short-term treasuries isn't a mistake. It isn't weakness. It isn't market timing.
It's collecting a steady yield while bringing your risk down to essentially zero.
Are Commodities a Better Buying Opportunity Than Stocks Right Now?
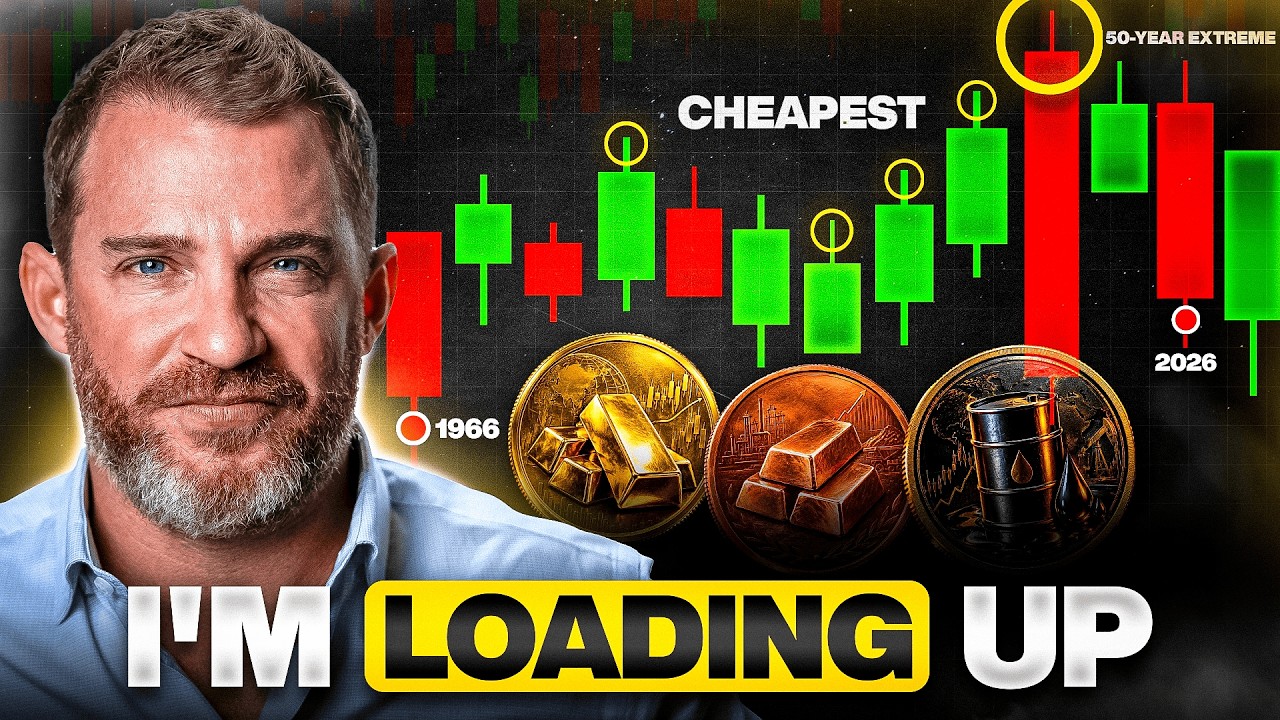
Commodities are the cheapest they've been versus stocks in 50 years
While stocks sit at their most expensive level in 25 years, commodities just hit their cheapest level relative to stocks in more than 50 years. That ratio has historically preceded major multi-year commodity runs.
The ratio in question is the price of commodities (oil, copper, gold, natural gas, grains, the whole basket) divided by the S&P 500. It goes back to the 1960s, and it's currently sitting at the lowest level on the entire chart.
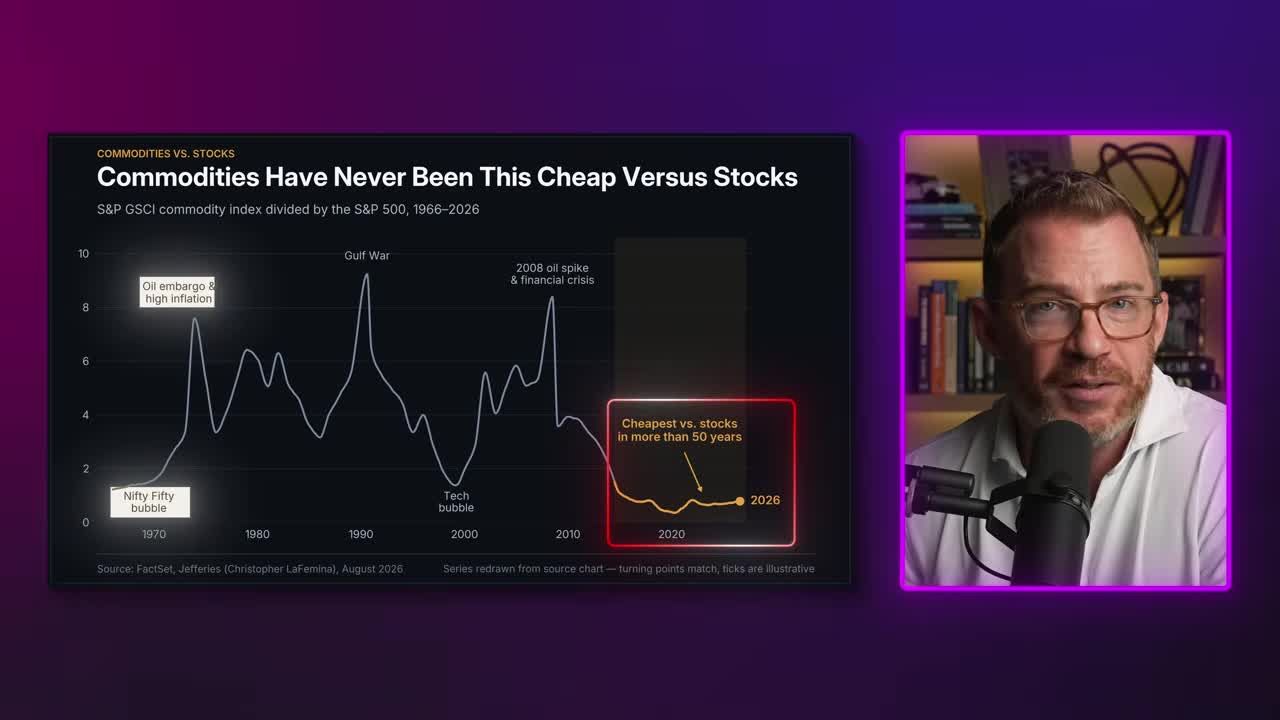
Every other time this ratio got this stretched, the outcome was the same:
- Early 1970s (Nifty Fifty bubble): Commodities went on a 10-year tear afterward.
- 1999 (tech bubble): Oil ran from $20 to $140 a barrel. Gold quadrupled.
- Today: The ratio just hit its cheapest point in over 50 years.
Every time stocks got this expensive relative to hard assets, the next decade belonged to the hard assets.
The reason is simple supply and demand. When commodities get this cheap, nobody invests in producing more of them. No new mines, no new oil fields, no new refineries. Then demand shows up and there's nothing on the shelf. Prices don't drift higher. They soar.
This has already started. In August, a research note called this ratio the cheapest in 50 years, and UBS told clients to position for a commodity upcycle. Wall Street has already figured it out.
Reading the Chart Setup
The Bloomberg Commodity Index is up roughly 50% over the past couple of years, which makes it look like the move already happened. Zoom out and the picture changes. This isn't a bet on what happens next week. It's a bet on what happens over the next decade.
The index ran from 60 to 140 during 2020 and 2021, then spent years building what looks like a large cup-with-handle pattern. And this isn't even adjusted for inflation. In real terms, commodities are far cheaper than the raw numbers suggest.
This setup reminds me of gold three years ago. Gold ran from 1,200 to 2,200 in 2019 and 2020, then spent several years building a similar shallow cup-with-handle pattern, consolidating and absorbing supply before it broke out in early 2024.
From there, gold ran from 2,200 to 5,500 over the next two years. I think we're still early in that move, and I think the broader commodity basket, especially copper, gold, and the industrial metals, is set up to do very well over the next 5 to 10 years.
What I'm Doing With My Own Money
I'm 43, so my time horizon is different than a lot of readers'. Here's my actual positioning: reduced stock exposure, some money in short-term treasuries earning 4% while I wait, a meaningful allocation to gold and commodities because I expect that cheap-versus-stocks ratio to mean revert, and the rest in active trades.
My trading account is up 75% year-to-date. It's not a multi-million dollar account and I'm not claiming it's earthshattering, but I have no problem with that return over three quarters.
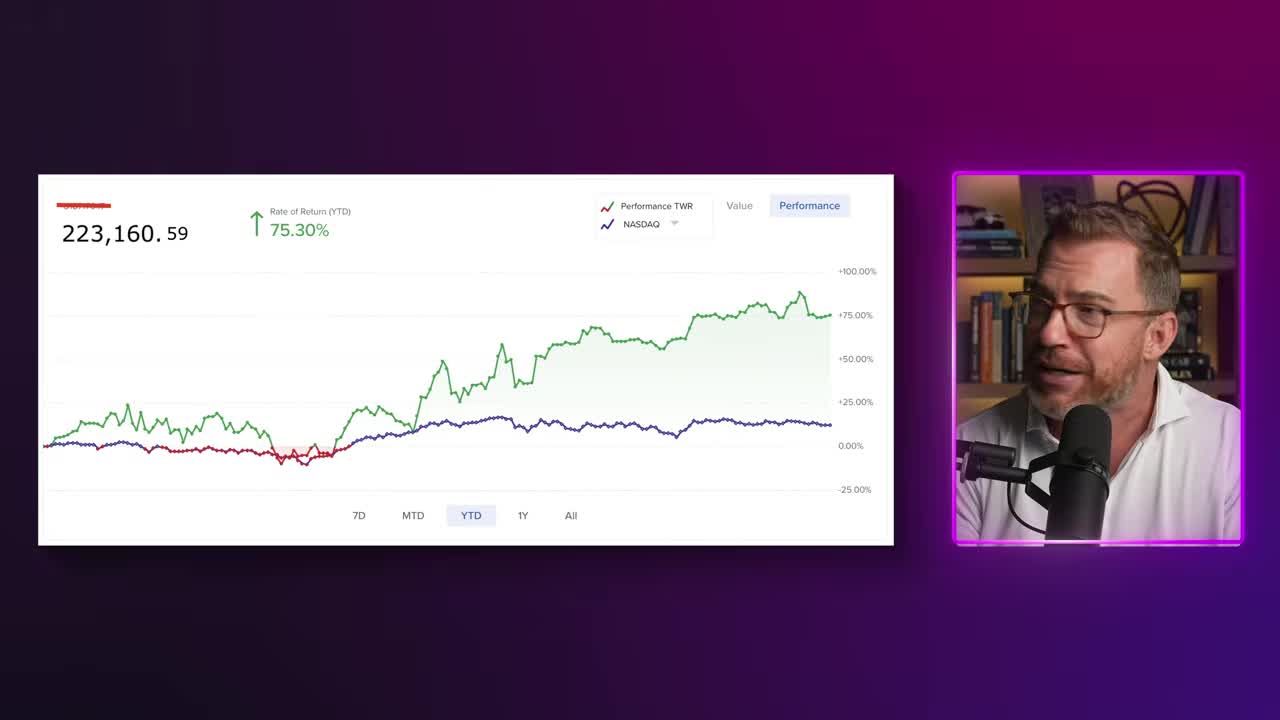
There was a dip early in the year, in February and March, when the Iran war started and tanked everything across the board. Since then there have been several solid opportunities.
Do I want that kind of volatility applied to my entire retirement nest egg? No, not really. But it's a way to generate real cash flow when conditions line up the way they do right now.
What I am not doing is buying the S&P 500 at 26 times earnings and hoping it works out over the next ten years. I refuse to look up in a decade with gold and copper having run hard while my stock portfolio sat flat the entire time. I've seen this chart before, and I know how these setups end.
This isn't a permanent stance, either. When the next real crash happens, whether that looks like 2000 or 2008, that will be the moment to go heavy with new money into the stock index, because that's when the real stock market buying opportunity shows up and the odds of high forward returns actually favor you.
Right now isn't that moment.
Final Thoughts: Position for the Setup
The stock market buying opportunity most people are chasing right now, buying the index and holding for a decade, isn't supported by the math. The equity risk premium is negative for only the second time since 2000, and the last time this happened, the S&P took thirteen years to get back to even.
That doesn't mean sit in cash and do nothing. It means recognizing where the actual opportunity sits: short-term treasuries paying more than stocks' earnings yield, a commodity basket at its cheapest level versus stocks in over 50 years, and individual stocks that will still make enormous moves even while the broader index goes nowhere.
The price you pay determines the return you get. Right now, stocks are asking you to pay the highest price of the century for a below-average expected return. Commodities are offering the opposite trade.
Position accordingly.
Get an entire year of live weekly mentoring sessions, my newsletter, indicators, bonus reports, tons more. Click the link and I'll see you in the next live session.
DISCLAIMER: Traders Agency does not offer financial advice. The information provided is for educational purposes only and should not be considered financial advice. Traders Agency is not responsible for any financial losses or consequences resulting from the use of the information provided. Trading carries inherent risks and may not be suitable for all individuals. You are advised to conduct your own research and seek personalized advice before making any investment decisions, recognizing the potential risks and rewards involved.
See more from Traders Agency on Google
Make us a preferred source and our market analysis will appear more prominently in your Google Search, Top Stories, and AI results.
Add to Preferred Sources